Tooling example

Mapping out all the work in a division or a company is a complex task, because it involves configuring the tool to align with the ways of working in the business, as well as mapping the dependencies between teams and departments.
Conceptually, the tool allows you to break the strategy down into six-month goals for the business. These can then be translated into plans (roadmaps), then into epics (blocks of delivery over three to six months), then into features (2–12 weeks), and finally into items or tasks to do the work.
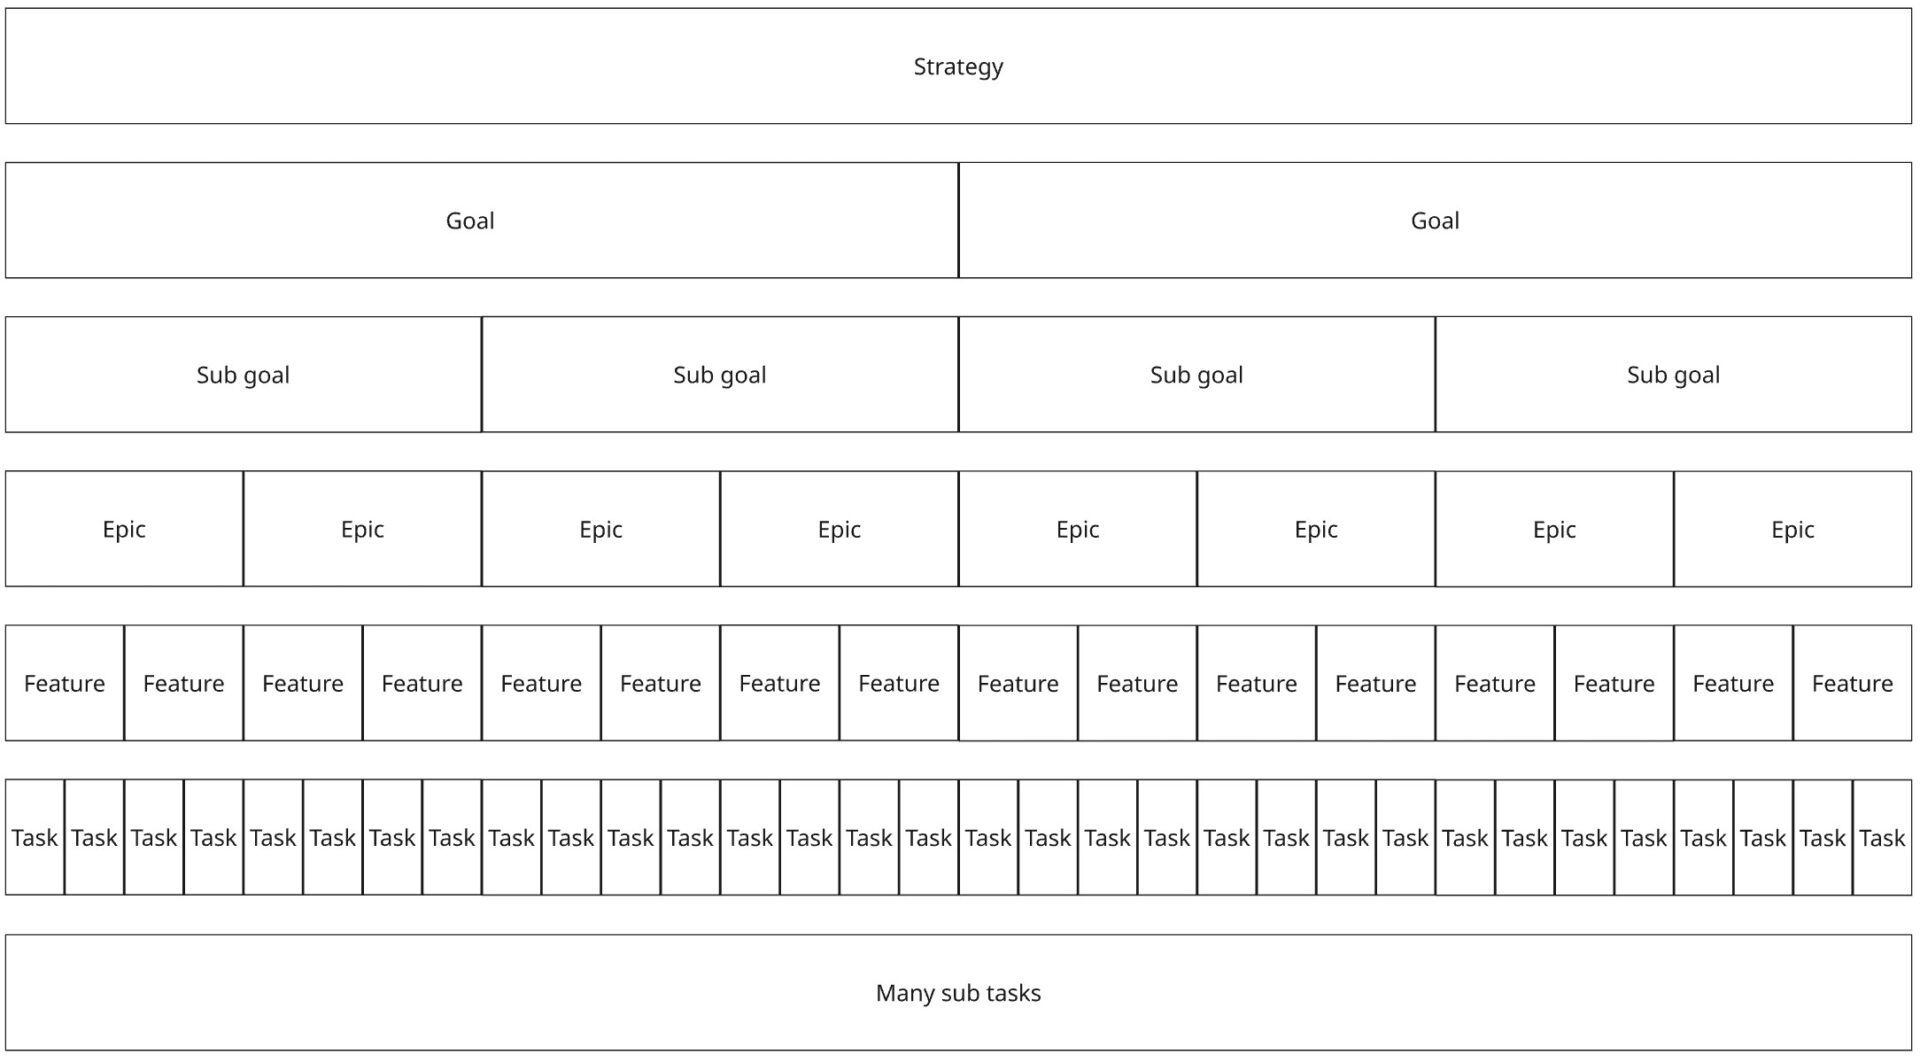
This means the work can be rolled up from a sub-task in a sprint right up to the overall strategy, with dashboards provided to summarise progress. This could look something like this:
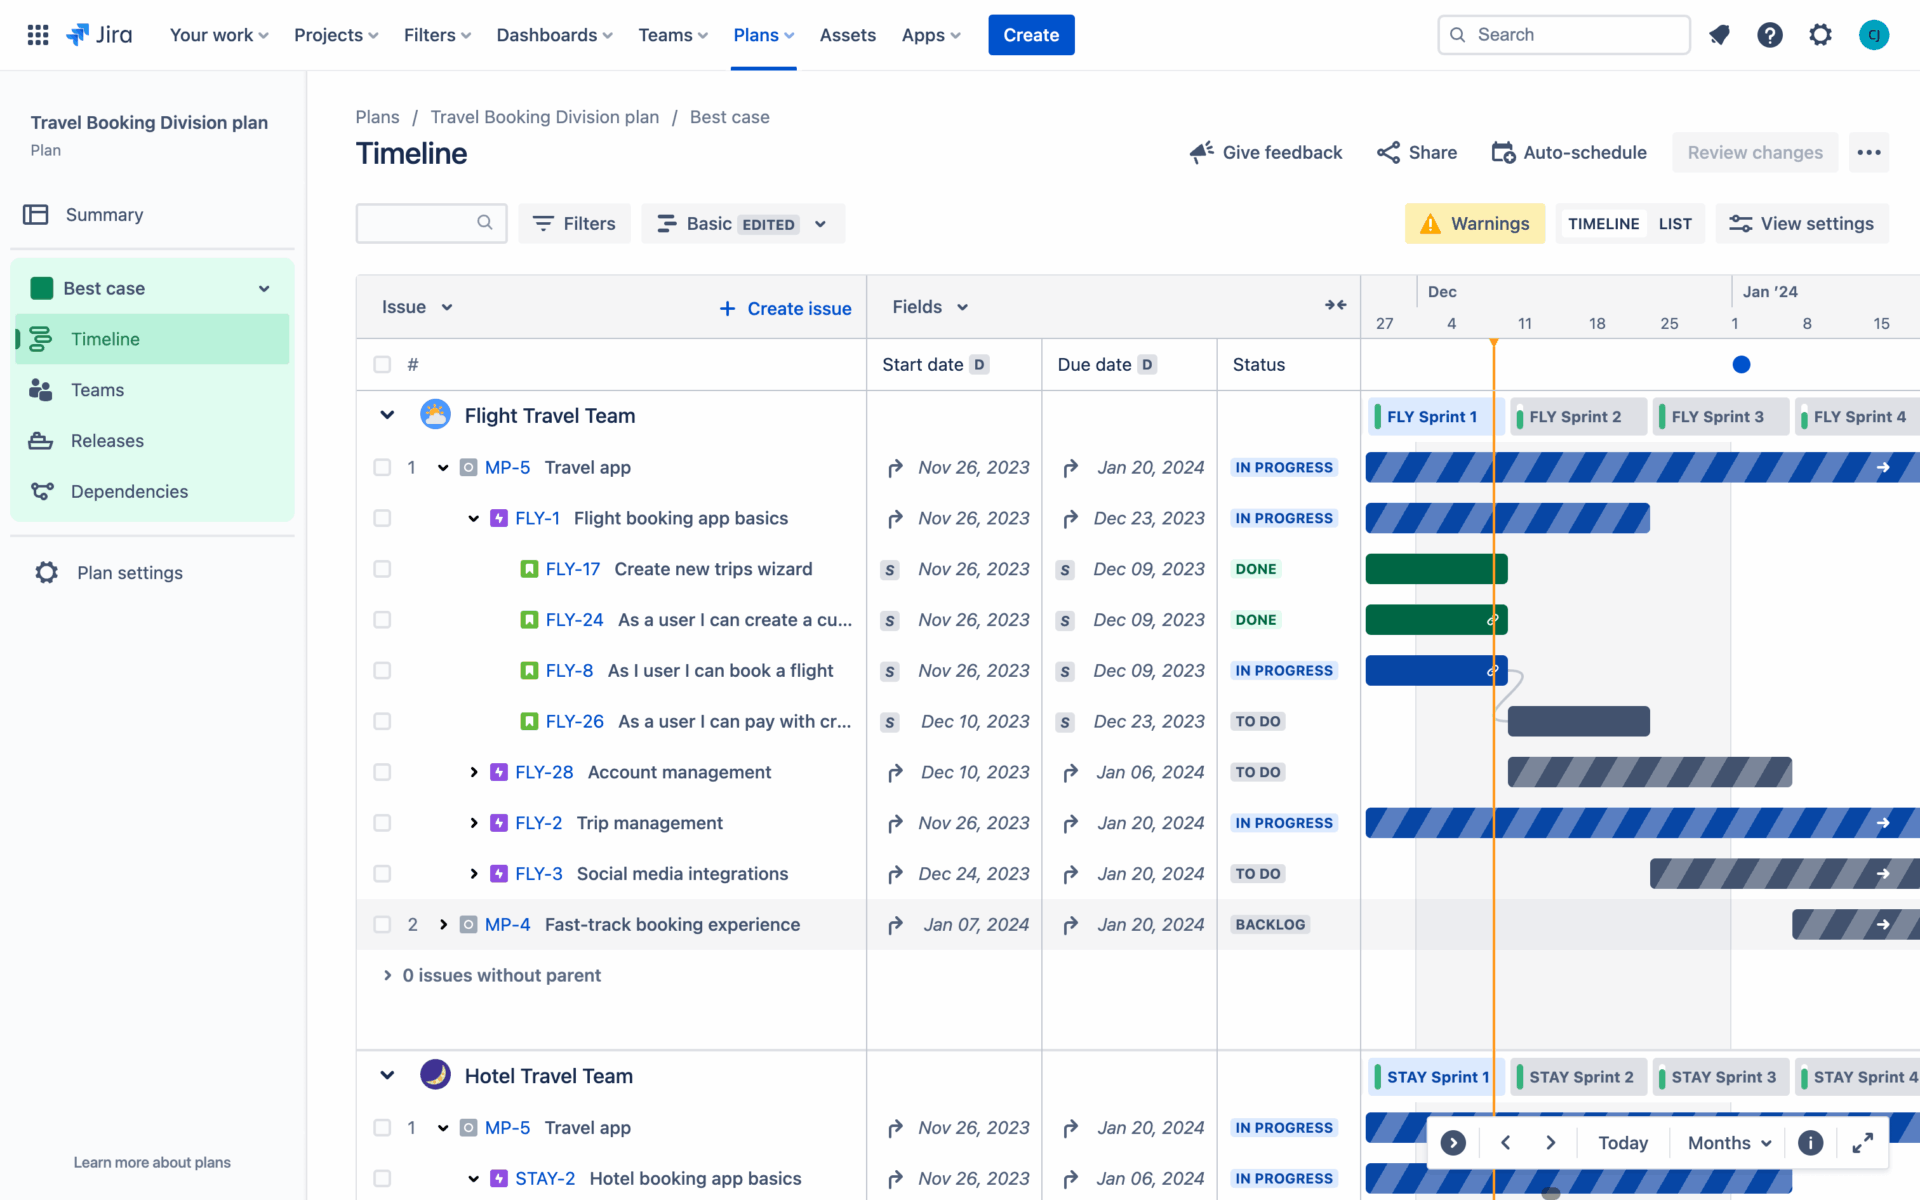
Then we get into specifics like:
- What do the boards look like for different teams (app, travel, etc.)?
- How do other divisions log demand for these teams?
- What are the milestones on the timeline?
- How are dependencies logged and tracked?
- What does stakeholder feedback sessions look like?
We help organisations structure these tools and then:
- Onboard people into the tool
- Train them in the use of the tool
- Assist with ingesting work into the tool
- Assist with the change process
- Assist with tool adoption strategy
- Help prevent “garbage in, garbage out” scenarios
We then help with the people and process elements that surface when a tool like this is used. If the reporting from the tool is not giving the view that’s needed, then either there is a people challenge around adoption and tool usage, or there is a process issue that results in information not showing up in reporting as expected.